

Fact-checked by the CapitalLendingNews editorial team
Quick Answer
Retirees who qualify using investment portfolio income typically receive the same conventional mortgage rates as working borrowers when income is properly documented., 30-year conventional rates hover near 6.8–7.1%. Asset-depletion or non-QM products, which convert portfolio balances into qualifying income, generally add 0.25–1.00 percentage points above conventional pricing.
A retiree with a $1.2 million brokerage account and a 780 credit score can qualify for a conventional mortgage at essentially the same rate a salaried borrower would receive, provided the investment income is documented correctly and passes lender scrutiny. The retiree investment income mortgage rate is not a separate product category; it is the result of how well you satisfy the same underwriting criteria any borrower faces. That distinction matters enormously for what you actually pay.
What changes for portfolio-dependent retirees is the documentation path and the risk of landing in non-standard loan products when income history is thin or variable. This guide covers how lenders calculate qualifying income from dividends, interest, and portfolio distributions; what rates realistic borrowers are seeing in early 2025; and where the process can push you into a higher-priced loan tier.
Key Takeaways
- Retirees who document two years of consistent investment income qualify for conventional loans, where 30-year fixed rates averaged roughly 6.9–7.1% in early 2025 (Freddie Mac Primary Mortgage Market Survey).
- Asset-depletion loans, which convert portfolio balances into monthly qualifying income, typically carry rates 0.25–1.00% above comparable conventional pricing, according to industry practitioners and Freddie Mac’s asset-utilization guidelines.
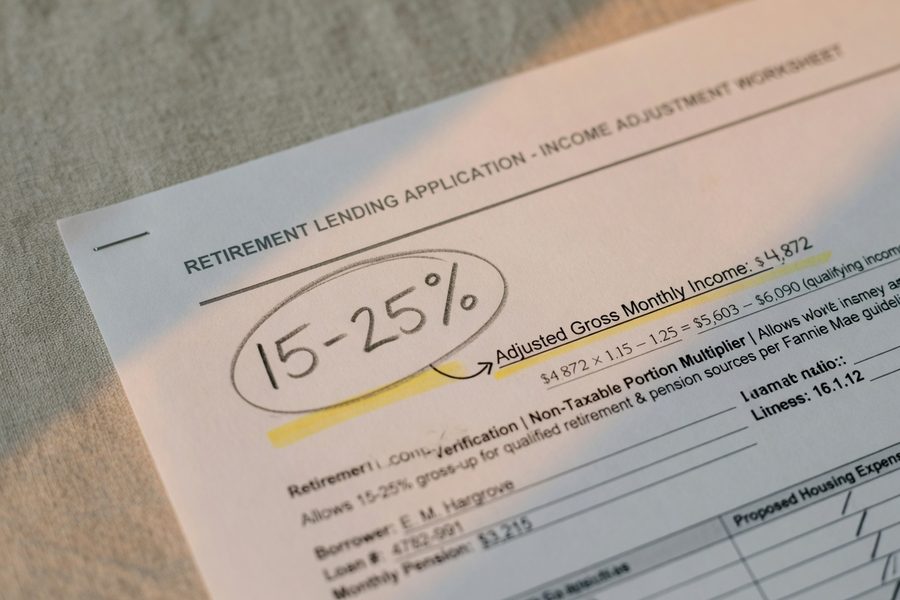
- Non-taxable retirement distributions can be grossed up by 15–25% by lenders, boosting qualifying income and potentially moving a borrower into a better rate tier (Fannie Mae Selling Guide).
- Asset-depletion calculations under Fannie Mae and Freddie Mac guidelines typically use 70–80% of eligible account balances divided by the remaining loan term in months, allowing qualification without requiring active withdrawals (Fannie Mae income documentation requirements).
- Credit score is the single largest rate determinant once income qualifies: a borrower at 760+ versus 680 can see a rate spread of 0.5–0.75% on a conventional loan, regardless of income source (CFPB Explore Interest Rates tool).
In This Guide
- Can Retirees Qualify for a Mortgage Using Only Investment Portfolio Income?
- How Lenders Calculate and Verify Investment Income
- What Interest Rates Do Portfolio-Dependent Retirees Actually Pay?
- Retiree Loan Scenarios in Early 2025
- Strategies to Secure the Best Possible Rate as a Retiree
- Risks and Trade-Offs of Financing a Home on Investment Income
Can Retirees Qualify for a Mortgage Using Only Investment Portfolio Income?
Yes, and more lenders accept it than most retirees expect. Fannie Mae’s Selling Guide requires that qualifying income be “reasonably expected to continue for the foreseeable future,” which investment income from a substantial, diversified portfolio can satisfy. Dividends, interest payments, and scheduled distributions all count, provided you can show a two-year history and demonstrate the accounts will remain accessible and funded.
Two Paths to Qualification
Retirees typically qualify through one of two routes. The first is documented investment income: dividends and interest reported on tax returns for two consecutive years, averaged into a monthly figure. The second is asset depletion (sometimes called asset dissipation or asset utilization), where the lender converts your portfolio balance into a hypothetical monthly income stream without requiring you to actually withdraw the money. Freddie Mac allows eligible assets to be used for repayment qualification under Section 5307.1 of its Single-Family Seller/Servicer Guide, giving borrowers a second option when income documentation alone falls short.
The Three-Year Continuance Hurdle
The most common sticking point is proving income will continue. Trust distributions and annuity income, for example, must meet a three-year continuance test under HUD’s Handbook 4155.1 guidance: guaranteed, constant payments must be verified as continuing for at least the first three years of the mortgage term. Variable distributions from brokerage accounts require lenders to confirm unrestricted access, that the account is not subject to penalty for early withdrawal, and that market-linked income is averaged rather than based on a peak year. Accounts held in 401(k) or IRA structures carry additional scrutiny, because the borrower must either be at or beyond age 59½ or demonstrate penalty-free access.
Retirement accounts subject to early-withdrawal penalties generally cannot be used in asset-depletion calculations under conforming guidelines. Only unrestricted or penalty-free funds count toward the portfolio balance that lenders divide into qualifying monthly income.
How Lenders Calculate and Verify Investment Income
The calculation method directly affects your qualifying income figure, which in turn shapes your debt-to-income ratio and, the rate you are offered. Lenders use different formulas depending on the income type, and choosing the right documentation strategy can mean the difference between conventional pricing and a non-QM premium.
Documented Income vs. Asset Depletion Math
For dividends and interest, the standard approach is a two-year average from Schedule B of your federal tax returns, translated into a monthly figure. If your dividend income was $48,000 in year one and $52,000 in year two, the lender uses $4,167 per month. For IRA or 401(k) distributions, the FHA requires lenders to use the average received over the previous two years (or the full period if received for less than two years) to calculate effective income, a rule that conventional lenders often follow as a baseline as well.
Asset depletion works differently. Lenders typically take 70–80% of eligible account balances, subtract any amounts required for down payment and closing costs, then divide the remainder by the remaining loan term in months. A borrower with $900,000 in an eligible brokerage account applying for a 30-year mortgage might see $720,000 (80%) divided by 360 months, producing $2,000 per month in imputed qualifying income. That figure stacks on top of any documented Social Security, pension, or dividend income the borrower receives separately.
The Gross-Up Advantage
Non-taxable income from certain retirement sources can be grossed up by 15–25%, depending on the lender’s guidelines and loan program. If a borrower receives $3,000 per month in non-taxable Roth distributions, a lender applying a 25% gross-up treats that as $3,750 in qualifying income. This can meaningfully shift the debt-to-income (DTI) ratio, which most conventional lenders cap at 43–45% for conforming loans. For retirees navigating complex income structures, understanding how DTI thresholds affect approval is worth reviewing alongside guidance on how DTI quietly kills loan applications.
What Interest Rates Do Portfolio-Dependent Retirees Actually Pay on New Loans?
Qualifying retirees pay market rates. There is no retirement surcharge baked into conventional loan pricing. A 68-year-old with a documented dividend income history and a 760 credit score receives the same rate grid as a 42-year-old W-2 employee with the same score, down payment, and DTI., Freddie Mac’s Primary Mortgage Market Survey placed 30-year fixed rates in the 6.8–7.1% range for well-qualified borrowers.
Where the Rate Premium Appears
The premium shows up when conventional documentation fails and borrowers shift to non-QM or portfolio products. These loans, often marketed as “asset-based” or “bank statement” mortgages, price at 0.25–1.00% above conventional conforming rates for similar credit profiles. A borrower who would receive 6.90% on a conventional loan might be quoted 7.40–7.90% on a non-QM asset-depletion product. That gap has a real cost. On a $600,000 loan over 30 years, the difference between 6.90% and 7.65% adds roughly $100,000 in total interest paid, the kind of number that makes it worth investing time in conventional qualification first. Given how significantly loan term length shapes total interest cost, it is also worth understanding how loan term length quietly controls total interest paid before choosing between a 15- and 30-year structure.
On a $600,000 mortgage, a rate of 7.65% versus 6.90% adds approximately $100,000 in total interest over a 30-year term, the approximate cost of taking a non-QM asset-depletion loan instead of qualifying conventionally with the same portfolio.
| Loan Product | Typical Rate (Feb 2025) | Best For |
|---|---|---|
| Conventional Conforming (Fannie/Freddie) | 6.80–7.10% | Two-year documented investment income, 43% or lower DTI |
| FHA (retirement income) | 6.70–7.00% | Lower down payments, averaged distribution history |
| Jumbo Conventional | 6.90–7.30% | Loan balances above $766,550, strong credit required |
| Non-QM Asset Depletion | 7.25–8.10% | Portfolio assets only, no documented income history |
| Non-QM Bank Statement | 7.50–8.25% | Irregular withdrawals, self-directed portfolios |
Retiree Loan Scenarios in Early 2025
Two concrete scenarios show how portfolio size and credit quality translate into rate outcomes. These are illustrative, but they reflect the documentation logic that actual underwriters apply.
Scenario A: A 70-year-old borrower with $1.5 million in a taxable brokerage account generating $62,000 annually in dividends and interest, a 760 credit score, and a 40% down payment on a $750,000 home. Documented income of roughly $5,167 per month against a $2,400 monthly principal-and-interest payment produces a housing DTI well under 50%. This borrower qualifies conventionally and receives a rate near the market benchmark, roughly 6.875% on a 30-year fixed in the current environment. Strong credit and a large down payment are doing the work here, not retirement status.
Scenario B: A 66-year-old borrower with $900,000 across a mix of taxable and Roth accounts, minimal documented distribution history (recently retired), and a 710 credit score seeking a $500,000 loan. Documented income does not easily satisfy two-year averaging. An asset-depletion calculation using 80% of the taxable portion ($600,000 of the $900,000) divided by 360 months yields $1,333/month in imputed income, thin for a $500,000 loan. This borrower likely routes to a non-QM product at 7.50–7.75%, unless they can supplement with Social Security, a part-time income stream, or a co-borrower. For situations involving two borrowers with uneven financial profiles, see how co-borrowers with mismatched credit scores affect the rate on a joint loan.
Apply for your mortgage before taking a large portfolio distribution for the year. Large one-time withdrawals can distort your two-year income average upward in ways that look irregular to underwriters, triggering additional documentation requests or income recalculation at lower figures.
Strategies to Secure the Best Possible Rate as a Retiree
The most direct route to conventional pricing is establishing a clean two-year income history before you apply. That means consistent, documented dividends and interest appearing on your tax returns for both years, not a lump-sum withdrawal timed to the loan application. Retirees who plan a home purchase two or more years out have time to set up a systematic withdrawal program that creates a verifiable income record.
Rate-Reduction Levers Within Your Control
Beyond income documentation, three variables have the most measurable effect on the rate you are offered. First, credit score: crossing the 760 threshold is the single highest-leverage improvement for most borrowers, worth 0.5–0.75% in rate savings versus a 680 score on most conforming loan matrices. Second, down payment size: a 30–40% down payment reduces loan-to-value to a tier where lenders apply their best pricing, and eliminates private mortgage insurance. Third, DTI ratio: paying off installment debts before applying directly lowers this figure, sometimes enough to move from a non-QM eligibility to conventional. Retirees who are weighing whether to liquidate a portion of their portfolio to pay off debts before applying will find it useful to think through the logic behind paying off a loan versus keeping an investment portfolio intact.
Shorter loan terms, 15 or 20 years rather than 30, carry lower base rates, typically 0.50–0.75% below comparable 30-year pricing. For a retiree with sufficient monthly cash flow, a 15-year term at roughly 6.25–6.40% versus 6.90% on a 30-year product represents a meaningful rate improvement, though the higher monthly payment must fit within the DTI ceiling. Buying down the rate with discount points is another option worth modeling: if you plan to stay in the home long-term, paying 1–2 points upfront to reduce the rate by 0.25–0.50% can break even within four to six years. For a detailed look at that calculation, see whether buying down your rate with points makes sense when home prices are still high.

Risks and Trade-Offs of Financing a Home on Investment Income
The math that makes a mortgage feel comfortable in year one can shift. Portfolio-dependent retirees face a specific vulnerability: a significant market drawdown reduces both the asset-depletion income figure and the actual wealth backing the loan simultaneously. If you refinance three years after closing and the portfolio has dropped by 30%, the asset-depletion calculation that originally justified your qualification may no longer hold up under the new loan’s guidelines.
Sequence-of-Returns Risk and Documentation Volatility
Variable dividends are the most underappreciated documentation problem. Companies cut dividends during recessions. A borrower who averaged $5,000 per month in dividends over 2022–2023 but sees $3,200 per month in 2025 after portfolio repositioning will have that lower figure averaged into any new income calculation. The opportunity cost calculation is also worth running honestly: if your portfolio averages a 7–8% long-term return and your mortgage rate is 6.90%, the spread is narrow enough that aggressive early payoff may not be the financially optimal strategy, but the certainty of the debt versus the variability of the return matters more as you age. There is no single right answer; there is only the answer that fits your specific sequence risk and income stability.
Documentation burden is another real cost. Lenders may request two years of brokerage statements, tax returns, account ownership documentation, and a letter confirming penalty-free access, considerably more paper than a W-2 borrower faces. Non-QM lenders sometimes add annual account-balance verification clauses, a post-closing scrutiny that conventional borrowers do not encounter. Retirees who have previously navigated non-standard income verification, such as those familiar with challenges faced by gig economy borrowers who pay higher effective rates due to income irregularity, will recognize the pattern: variable income almost always creates lender friction that translates into either rate premium or documentation workload, and usually both.
Frequently Asked Questions
Do retirees pay higher mortgage rates than working borrowers just because of their age?
No. The Equal Credit Opportunity Act prohibits lenders from using age as a factor in loan pricing or approval decisions. Rate differences arise from income documentation quality, credit score, DTI, and loan type, not retirement status itself.
What is an asset-depletion mortgage and how does it affect the rate?
An asset-depletion mortgage converts a portion of your portfolio balance into a hypothetical monthly income figure, allowing qualification without documented withdrawals. When processed as a conventional conforming loan under Fannie Mae or Freddie Mac guidelines, rates are standard market pricing. When it requires a non-QM product, expect a 0.25–1.00% premium above conventional rates for equivalent credit profiles.
How much portfolio balance does a retiree typically need to qualify for a $500,000 mortgage through asset depletion?
Using a standard 80% factor on a 30-year term, a $500,000 loan requires roughly $3,900 per month in qualifying income from the asset-depletion calculation alone, meaning approximately $1.75 million in eligible assets to produce that income figure without any other income sources. With Social Security or dividend income supplementing the calculation, the required portfolio balance drops substantially.
Can a retiree use a Roth IRA or taxable brokerage account for asset depletion?
Taxable brokerage accounts generally qualify without restriction. Roth IRA assets may qualify if the borrower is 59½ or older and past the five-year holding period, making withdrawals penalty-free. Traditional IRA and 401(k) funds must meet penalty-free access criteria before they count toward asset-depletion calculations under most conforming guidelines.
Does a large down payment meaningfully lower the rate for retirees?
Yes, in two ways. A down payment of 30–40% moves the loan-to-value ratio into the lender’s best pricing tier, reducing the rate by 0.125–0.375% on most conventional matrices. It also eliminates private mortgage insurance, cutting the effective cost further. For retirees whose income qualification is marginal, a larger down payment also reduces the required qualifying income, sometimes enabling conventional instead of non-QM approval.
What happens to my mortgage qualification if my dividend income drops after closing?
Nothing happens to your existing loan, once closed, the terms are fixed and the lender cannot modify them based on subsequent income changes. The risk appears at refinance: if dividends have declined, a new lender will average in the lower figures, potentially qualifying you for a smaller loan amount or a less favorable product. Keeping income history stable in the two years before any planned refinance is the practical safeguard.
Should a retiree choose a 15-year or 30-year mortgage term?
A 15-year term carries a lower base rate, typically 0.50–0.75% below the 30-year equivalent, and eliminates interest cost over the back half of the amortization schedule. The trade-off is a higher monthly payment that must fit within DTI limits. Retirees with substantial, stable income and no near-term liquidity concerns often find the 15-year term the better financial choice, but those who prioritize keeping monthly obligations low to preserve cash flow flexibility will accept the higher rate for a lower required payment.
Sources
- Fannie Mae Selling Guide, B3-3.1-01: General Income Information
- Fannie Mae Selling Guide, B3-3.4-03: Annuity, Pension, or Retirement Income
- Freddie Mac Single-Family Seller/Servicer Guide, Section 5307.1: Asset Utilization
- U.S. Department of Housing and Urban Development, HUD Handbook 4155.1, Section 4.E: Trust Income
- FHA.com, Retirement Income to Qualify for an FHA Loan
- Freddie Mac, Primary Mortgage Market Survey (PMMS)