
Fact-checked by the CapitalLendingNews editorial team
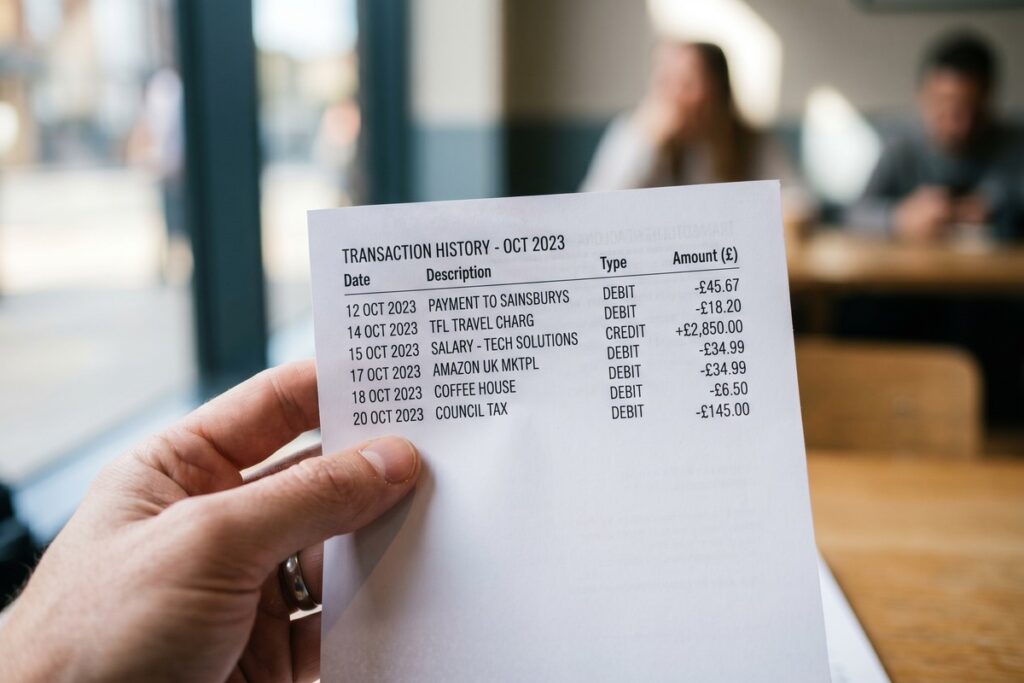
A borrower with a 720 FICO score recently received two personal loan offers for the same $15,000 amount: one at 14.2% APR and one at 19.8% APR. The credit score was identical. The difference came from what each lender found when they looked beyond the credit report, into the actual transaction history sitting inside the applicant’s checking account. This is how bank history interest rate pricing works in practice, and most borrowers have no idea it is happening.
The scale of this quiet underwriting track is growing fast. Fintech lenders now originate 53% of personal loans as of Q2 2025, up from 43% just a year prior, and they rely on cash-flow and banking-history data far more than traditional lenders do. Meanwhile, the gap between excellent-credit and poor-credit personal loan rates sits at roughly 12 percentage points: 14.48% for borrowers with scores above 720 versus 26.65% for those below 630. That gap is not driven by credit scores alone. Behavioral signals from your banking history are quietly filling in the spread.
This article breaks down the five specific data points lenders extract from your banking history to build your rate, explains the regulatory framework that governs this practice, and gives you a concrete plan for improving those signals before you submit your next application. You will leave with a working understanding of how the risk-premium formula operates and what you can realistically move in your favor.
Key Takeaways
- Personal loan rates range from 14.48% for excellent-credit borrowers to 26.65% for those below 630, a 12.17 percentage point spread driven by risk signals that include banking behavior, not just credit score.
- Average daily balance (ADB), not your month-end statement balance, is the metric lenders actually calculate; a healthy ending balance can mask a near-zero midmonth pattern that raises your risk premium.
- Overdraft and NSF frequency is a formal regulatory trigger: Freddie Mac’s Selling Guide requires additional scrutiny when NSF fees appear, and FHA guidelines mandate manual underwriter re-review when the automated system flags them.
- Experian launched its Cashflow Score in March 2025, and Equifax’s Prism/CashScore already scores transaction-level bank data on a 300–850 scale, meaning behavioral bank-account analysis is now an automated, standardized pricing input, not just a manual underwriter review.
- 79% of overdraft and NSF fees fall on just 9% of accounts, typically those with median balances under $350, the same population that faces the steepest rate premiums on their next loan application.
- Shopping with multiple lenders saves borrowers over $1,000 per year on a mortgage, according to Freddie Mac research, a gain that compounds when combined with behavioral housekeeping that reduces your lender’s risk premium.
In This Guide
- Why Your Credit Score Is Only Half the Story
- Data Point 1: Average Daily Balance
- Data Point 2: Overdraft and NSF Frequency
- Data Point 3: Income Consistency and Deposit Patterns
- Data Point 4: Cash-Flow Volatility and Spending Behavior
- Data Point 5: Relationship Depth and Account Tenure
- How Open Banking Makes This Data Faster to Pull
- What You Can Do in the 90 Days Before You Apply
Why Your Credit Score Is Only Half the Story
Credit bureaus capture a retrospective snapshot: what you owe, whether you paid on time, how long your accounts have been open. What they cannot capture is how you actually manage money between pay cycles. Whether your account runs close to zero every two weeks, whether you regularly overdraft on the same day of the month, whether your stated income actually shows up as deposits. Lenders have always known this gap exists.
The answer lies in risk-based pricing. According to the Federal Reserve Bank of Minneapolis, lenders construct a loan rate by adding a default-risk premium on top of their cost of funds, operating costs, and profit margin. The default-risk premium is the variable that moves based on what the lender learns about you. Anything in your banking history that signals instability: low average balances, irregular income, frequent overdrafts, pushes that premium up before the lender ever calls you with a quote.
Two Separate Tracks Running at the Same Time
When you submit a loan application, the lender typically runs two parallel evaluations. The first is the standard credit pull: FICO score, payment history, utilization ratio, derogatory marks. The second is increasingly a behavioral review of your actual transaction data. These tracks feed into the same rate-building formula, but they are scored separately and can produce very different signals.
A borrower with a clean credit file but erratic cash flow can end up at the same rate tier as someone with a slightly lower FICO score who shows stable, predictable banking behavior. The FinRegLab cash-flow underwriting research confirmed this in empirical terms: cash-flow variables drawn from bank account data are predictive of credit risk across diverse borrower populations and across multiple loan product types, and adding that data to credit bureau data measurably improves underwriting accuracy. That is why lenders are using it. And that is why borrowers who understand the five specific data points below hold a real informational advantage.
An estimated 45 million Americans are “credit invisible” or have unscorable credit files. For these borrowers, bank-account transaction data may be the primary, or only, signal lenders can use to build a rate, making cash-flow underwriting especially consequential for this population.
Data Point 1: Average Daily Balance
Most people monitor their bank account by checking the balance at the end of the month, or when they log in to pay a bill. Lenders do not work from that number. They calculate your average daily balance (ADB): the sum of your end-of-day account balances over a defined period, divided by the number of days. The difference matters enormously.
A borrower can show a month-end balance of $4,200 while having spent most of the month running between $80 and $300. The month-end snapshot looks fine. The ADB tells the actual story. Lenders reviewing 90 days of bank statements will compute ADB manually or through automated parsing software, and they use it because it exposes the midmonth cash crunch that a single balance figure hides.
The Threshold That Changes Your Rate Tier
For small business lending, FinRegLab’s research documented that borrowers maintaining average account balances at least 2.5 times their monthly fixed expenses were measurably more likely to receive favorable terms. The personal-finance equivalent is not an official published threshold, but underwriters routinely look for ADB that comfortably covers one to two months of proposed debt service. If your ADB barely covers your current recurring obligations, the lender concludes that adding a new payment creates meaningful default risk, and the rate reflects it.
The OCC’s Comptroller’s Handbook on Interest Rate Risk specifies that historical trend analysis of individual account behavior is a core input to bank pricing models. ADB trend is specifically relevant: an ADB that was $3,500 twelve months ago and is now $1,200 signals deteriorating cash position even if the credit bureau report shows no new derogatory marks.
How to Improve Your ADB Before Applying
The 60 to 90 days before you apply represent a genuine window to move this number. Shifting one paycheck cycle’s worth of savings into your primary checking account, not a savings account, raises your ADB for the period the underwriter will study. Reducing discretionary spending that clears out your buffer in the days before each paycheck also improves the picture.
What you should not do is move large lump sums in right before the application date, then move them back out. Underwriters are trained to spot exactly that pattern, and it raises sourcing questions rather than answering them.
A borrower whose banking history increases their default-risk premium by even 2 to 3 percentage points pays hundreds of dollars more over the loan term, a real cost that moves independently of whatever the credit bureaus are reporting.
Data Point 2: Overdraft and NSF Frequency
An overdraft is not just a bank fee. To a lender reviewing your account history, it is a behavioral data point that says: on this date, your outflows exceeded your available balance. One occurrence two years ago reads very differently from a pattern of four or five per year. Understanding how lenders interpret overdraft and NSF (non-sufficient funds) frequency matters because this is one of the few bank-history items with explicit regulatory consequences, not just soft underwriter judgment.
Freddie Mac’s published Selling Guide requires additional scrutiny when NSF fees appear in a borrower’s bank statements. FHA guidelines mandate manual underwriter re-review when the automated underwriting system flags NSF activity. These are not discretionary lender policies. They are codified rules that trigger a separate, slower, more expensive underwriting process, one that often results in a higher rate or a conditional approval requiring additional documentation.
Frequency Versus Recency
Underwriters apply a two-dimensional lens to overdraft history. Frequency matters: a single NSF in a 24-month review window is generally treatable as an anomaly. Three or more in a 12-month window suggests a structural cash-flow problem. Recency matters too: an NSF six months before application carries more weight than one from 18 months ago, because it speaks to your current financial management rather than a past circumstance you have moved past.
The disproportionate impact of this data point is worth naming directly. CFPB research found that 79% of overdraft and NSF fees are paid by just 9% of accounts, and those accounts typically carry median balances under $350. These are the same borrowers who already face elevated interest rates when they apply for credit. The bank-history pricing mechanism effectively compounds the disadvantage: lower balances produce overdrafts, overdrafts produce NSF fees, NSF fees produce higher loan pricing.
Overdraft protection transfers, where the bank pulls funds from a linked savings account to cover a shortfall, still show up as potential cash-management flags in some underwriting reviews, even though no fee is charged. A lender parsing 90 days of statements can see the transfer event regardless of how your bank labels it.
What the Delinquency Data Says About Pricing Risk
The link between behavioral cash-flow signals and actual default rates is not theoretical. TransUnion data via LendingTree shows that personal loan accounts 60 or more days past due reached 3.99% in Q4 2024, with 15% of subprime personal loan borrowers hitting that threshold compared to negligible rates in the prime segment. Lenders have quantitative evidence that behavioral signals like NSF frequency are predictive of eventual default, which is precisely why they price for it.

Data Point 3: Income Consistency and Deposit Patterns
When a lender has your pay stubs and W-2 in the file, they cross-reference those documents against your actual deposit history. If your stated income is $6,500 per month but your deposits show $5,100 to $5,300 arriving in two-week increments, the lender has a confirmation problem. That discrepancy, even when it has a perfectly innocent explanation, triggers a documentation request that can reset the clock on your application and, in some cases, prompts a rate revision.
Lenders specifically look for what underwriters call properly sourced and seasoned deposits. Sourcing means the money came from where you say it did: employment income, self-employment revenue, or documented transfers between your own accounts. Seasoning means it has been in your account long enough, typically 60 days, to rule out a short-term loan or undisclosed liability that artificially inflates your apparent cash position before the application window.
The Self-Employed and Gig Worker Problem
For W-2 employees, income verification is straightforward: two pay stubs, one W-2, deposits that match. For self-employed borrowers, contractors, and gig workers, the picture is messier. Irregular deposit patterns force lenders to use a longer look-back window, 12 to 24 months rather than two to four weeks, and bank-statement loans for self-employed borrowers carry a structurally higher rate, typically 0.5 to 1.5 percentage points above comparable full-documentation loans, to offset the income-verification uncertainty.
If you are self-employed and applying for a major loan, our article on fixed versus adjustable rate loans for self-employed borrowers covers the rate-structure tradeoffs in detail. The key point here is that the 24-month look-back is not just a longer version of the 12-month review. It can produce a meaningfully different income average if your business had a difficult year, and choosing which window to present is a strategic decision, not just a paperwork formality.
Large Deposits That Cannot Be Explained
A deposit that appears suddenly, a $12,000 transfer two weeks before application, a cash deposit without a corresponding income event, creates an immediate underwriter flag. The concern is not that you received money. The concern is that the money might represent an undisclosed loan that would increase your actual debt burden. This is also why gambling winnings, even documented ones, require careful handling: they are legitimate income but are not recurring, and some lenders will exclude them from income calculations entirely.
The CFPB’s Personal Financial Data Rights rule (Section 1033) specifically notes that lenders can use transaction data, including income and expense history, held by other institutions to extend credit on better terms, meaning a lender you have never banked with can, in principle, access your deposit history through a permissioned data connection to assess your income consistency before quoting a rate.
Data Point 4: Cash-Flow Volatility and Spending Behavior
Beyond average balances and overdraft counts, a newer class of lenders, particularly fintechs and open-banking platforms, now analyze the rhythm of your transactions. They are not just asking “what is your balance?” They are asking: how much runway do you maintain between paydays? Do recurring obligations clear before discretionary spending? Does your account balance follow a predictable wave pattern, or does it spike and crash unpredictably?
This is cash-flow underwriting, and it has recently crossed from manual review territory into automated scoring. In March 2025, Experian launched its Cashflow Score, a 300 to 850 numerical score derived from transaction-level bank account data, designed to sit alongside the traditional credit score in a lender’s decisioning system. Equifax has offered its Prism and CashScore products to lenders for several years. Both products translate behavioral banking patterns into a standardized numeric output that lenders use across credit cards, personal loans, and auto loans. What was previously a subjective underwriter judgment call is becoming a machine-generated, reproducible input.
What Spending Patterns Actually Raise a Flag
High month-to-month variability is the clearest signal. If your account balance swings from $4,000 to $180 within a single pay cycle, the cash-flow score registers that as elevated volatility. Frequent small withdrawals that steadily drain your buffer in the final week before payday, especially at ATMs or point-of-sale terminals, are parsed as an indicator that fixed obligations are consuming nearly all available income. Large irregular outflows that do not correspond to identifiable recurring obligations prompt questions about undisclosed debt, medical expenses, or other liabilities.
Stability signals, by contrast, include consistent minimum balance floors, recurring deposits that arrive within a predictable day-of-week window, and monthly outflows that leave a buffer rather than zeroing out. These patterns do not require high income; they require disciplined cash management. A borrower earning $4,200 per month who consistently maintains a $600 minimum balance reads as more stable than a borrower earning $7,000 per month who regularly grazes near zero.
For workers whose income already fluctuates by design, this data point is particularly challenging. Our coverage of how gig economy workers pay a higher effective interest rate than traditional employees examines how cash-flow scoring affects non-traditional income earners specifically. The short version: the scoring systems were largely calibrated on W-2 employment patterns, and irregular deposit timing can produce volatility flags even when the total income is adequate.
Fintech lenders captured 53% of personal loan originations in Q2 2025, up from 43%, and these lenders rely most heavily on cash-flow and behavioral banking data in their rate-setting models, meaning the majority of new personal loans are now priced with transaction-level analysis as a standard input.
The FinRegLab Evidence Base
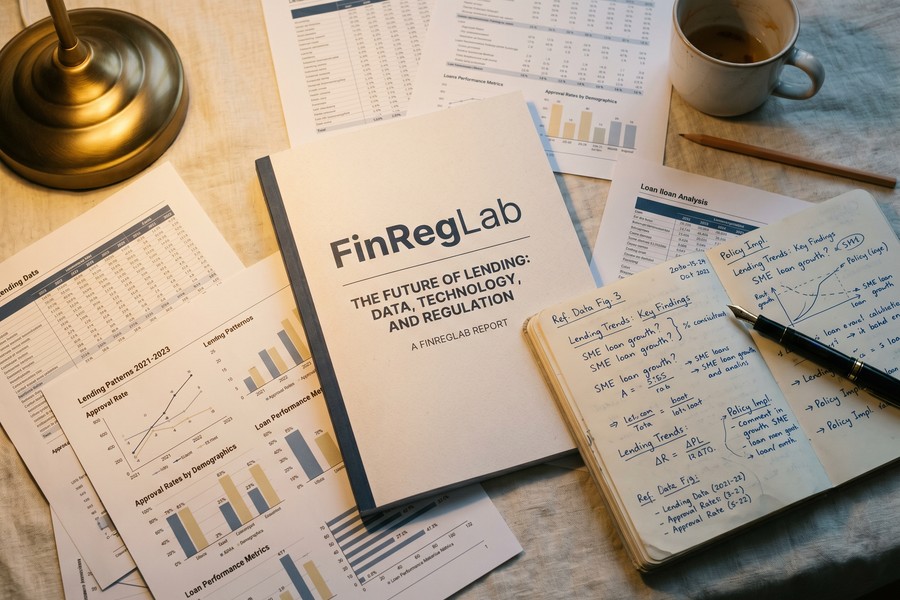
The empirical foundation for cash-flow underwriting comes largely from FinRegLab’s independent research program. Their market context and policy analysis documents how lenders increasingly use electronic bank account data, including income flows, cash reserves, and transaction patterns, in cash-flow underwriting for both consumer and small business credit. A subsequent FinRegLab study found that models combining machine learning with cash-flow data produced measurable improvements in underwriting accuracy and credit access compared to bureau-only approaches. The research is important precisely because it moves the conversation from anecdote to empirical confirmation: this data predicts default risk, and it does so across populations and product types.
Data Point 5: Relationship Depth and Account Tenure
Banks price existing customers differently from new applicants. This is not a marketing promotion. It has a structural explanation rooted in the rate-building formula described earlier: when a lender already holds your checking account, direct deposit, and perhaps a savings product, they have months or years of transaction data that reduces their information uncertainty. Lower information uncertainty translates directly to a lower default-risk premium. The relationship discount is real, and it is built into the rate formula before a human ever reviews your file.
Account tenure is a specific signal within this category. An account that has been open for three years, with consistent direct deposit, a stable ADB, and no product gaps, tells the lender something the credit bureau cannot: this borrower manages their primary financial relationship responsibly over time. That history has value as a risk-mitigating signal, and lenders assign lower risk margins to accounts with longer clean histories.
What “Relationship Assets” Actually Count
Not all account features carry equal weight. The elements lenders most consistently credit toward relationship-based pricing include: direct deposit linked to your paycheck (confirms stable employment and keeps transaction data flowing), maintaining multiple products at the same institution (checking plus savings, or checking plus a prior loan that performed well), and average checking account balances above the lender’s internal threshold for “engaged depositor” status. Certificate of deposit holdings at the same institution also factor in, as they represent captive capital and signal a long-term financial relationship.
What lenders are much less likely to credit: a joint savings account opened last month, a checking account that receives only occasional transfers rather than direct deposit, or a relationship built entirely through a mobile-only bank with no loan product history. The relationship discount is earned over time, not assembled quickly for an application.
The Information Asymmetry Argument for Applying With Your Primary Bank First
When you apply for a loan with an institution that has never held your deposits, that lender starts from a position of maximum information uncertainty. They may pull a cash-flow score or request permission to link your accounts via open banking, but absent that data, they lean on bureau data alone and compensate for the information gap with a wider risk margin.
Applying first with your primary bank or credit union, before shopping externally, often produces a better initial offer precisely because the lender is pricing from a richer data set, not from cold-file analysis. This matters most for borrowers whose bureau file is thin but whose banking history is strong: a category that includes many recent immigrants, young adults, and people who have historically preferred cash or debit. The relationship rate is not advertised, and many borrowers never realize they qualify for it because they applied online with a lender who had no prior access to their behavioral data. Understanding how this mechanism works also connects to the broader topic of how fintech lenders use payroll data to approve borrowers traditional banks would reject, the same information-asymmetry problem, solved from the other direction.
| Borrower Profile | Relationship Depth | Typical Rate Impact | Key Lender Signal |
|---|---|---|---|
| Existing depositor, 3+ years direct deposit | High | 0.25–0.75% rate reduction | Full transaction history available |
| Existing depositor, less than 12 months | Moderate | Minimal discount, limited history | Short track record, incomplete signal |
| New applicant, permits account linking | Partial | Neutral to slight reduction | Read-only transaction data from prior bank |
| New applicant, no account linking | None | Full market rate, no discount | Bureau data only, maximum information gap |
How Open Banking Makes This Data Faster to Pull
For much of lending history, pulling bank transaction data meant asking the borrower to submit paper statements, which were then manually reviewed. That process took days and introduced human error. Today, many lenders ask borrowers to link accounts through a secure portal, typically powered by data aggregators like Plaid, Finicity, or MX, that provides read-only access to up to 24 months of transaction records in seconds. What the lender receives is not a PDF. It is a structured data feed that can be parsed by scoring algorithms, matched against income claims, and fed directly into a rate-building model.
When you click “Connect Your Bank Account” on a loan application, you are consenting to provide every deposit, withdrawal, transfer, fee, and balance reading for the period the lender requests. The lender can see your employer name from recurring ACH deposit descriptions, your recurring subscription charges, your casino or lottery app transactions, your overdraft fees, and your ADB, all without ever asking you a single question about any of it.
The Regulatory Grey Zone in June 2025
The governing framework for this practice has been unsettled throughout 2025. The CFPB finalized its Section 1033 personal financial data rights rule in October 2024, establishing that financial institutions must make consumer transaction data available upon request and that third parties, including lenders, can access it with consumer consent. The rule was intended to standardize data formats, cap third-party data retention, and give consumers meaningful opt-out rights.
A federal court stayed the rule in early 2025, halting its implementation while legal challenges proceed. The situation is active uncertainty: the rule’s full framework is not yet enforceable, lender practices vary significantly, and consumer consent protections that Section 1033 would have standardized are not uniformly in place. In practical terms, when a lender today asks you to link your bank account, the data they can retain, how long they can keep it, and what restrictions apply to its use depend on the lender’s own policies and any state-level privacy laws that apply, not a uniform federal standard.
Before linking your bank accounts during a loan application, ask the lender in writing how long they retain the transaction data, whether they share it with third parties, and what your rights are to request deletion after the application is decided. Reputable lenders will answer these questions. If a lender cannot or will not answer, that is a meaningful signal about their data practices.
The Double-Edged Nature of Open Banking
It would be a mistake to frame open banking data purely as a threat to borrowers. For the estimated 45 million Americans with thin or nonexistent credit files, the ability to share real banking history with a lender may be the only path to a favorable rate, or to any approval at all. Cash-flow underwriting has demonstrably improved credit access for populations that traditional FICO-based underwriting systematically underserved, as documented in the FinRegLab research. This is a genuine benefit, not a talking point.
The honest concession is that the same data that helps a cash-flow-stable borrower without a deep credit file also exposes cash-flow-volatile borrowers to pricing consequences they were previously shielded from by the opacity of the process. Open banking does not create new risk. It makes existing behavioral risk visible and priceable. For borrowers whose transaction history tells a favorable story, that visibility is an asset. For borrowers whose history is messy, it is a liability, and understanding that distinction is the entire point of this article.
| Open Banking Data Category | What Lenders Extract | Rate Effect |
|---|---|---|
| Income deposits | Amount, frequency, employer name, consistency | Positive if stable and matches stated income |
| Average daily balance | Calculated across 60–90 days automatically | Higher ADB lowers risk premium |
| Overdraft/NSF events | Date, frequency, recency | Any pattern raises premium; triggers regulatory review |
| Recurring obligations | Subscription, loan, and bill payments visible as ACH | Used to recalculate true debt-to-income ratio |
| Spending behavior | Transaction category mix, buffer maintenance | Volatility flags increase Cashflow Score risk tier |
What You Can Do in the 90 Days Before You Apply
The rate your lender quotes reflects a snapshot, typically 60 to 90 days of account activity for bank-statement reviews, sometimes up to 24 months for full cash-flow underwriting. That window is finite and, to a meaningful degree, manageable. The borrowers who receive the most favorable risk-premium calculations are not necessarily the ones with the highest incomes or the longest credit histories. They are often the ones who understood what was being measured and spent three months making sure the measurement looked good.
Consolidate to Your Strongest Account
If you have money spread across three checking accounts, consolidate your primary financial activity into the one with the highest ADB and cleanest transaction history before the application window opens. The account you link or submit statements for should be the account that tells your strongest story. This is not gaming the system; it is the same logic as submitting your best-performing quarter’s financials rather than your worst.
The Look-Back Window Is a Strategic Decision for Self-Employed Borrowers
For self-employed borrowers, the choice between a 12-month and 24-month bank-statement look-back is not just administrative. It is one of the most consequential rate decisions you can make. A 12-month window that captures a strong recent year may produce a better income average than a 24-month window that includes a difficult prior year. Conversely, a 24-month window that demonstrates consistent growth can unlock rate tiers that a 12-month window showing a single good year cannot. Before you authorize any look-back period, calculate both averages and understand which one serves your application.
Our article on debt-to-income ratio on digital lending platforms covers how income averaging interacts with DTI calculations in digital underwriting, a related variable that the same bank transaction data is used to calculate.
Freddie Mac research shows that shopping with multiple lenders saves borrowers over $1,000 per year on a mortgage. Pair rate shopping with bank-history housekeeping, improving your ADB, eliminating overdrafts, and stabilizing your deposit pattern, and you capture two independent savings levers: market-rate spread reduction from lender competition, plus risk-premium reduction from improved behavioral signals.
| Action | Timeframe | Likely Impact on Rate |
|---|---|---|
| Raise average daily balance by 25%+ | 60–90 days | Moderate rate improvement; reduces cash-flow risk score |
| Eliminate all overdrafts/NSFs | 90+ days before application | Removes regulatory trigger; avoids manual review |
| Establish direct deposit at primary bank | 60+ days before application | Builds relationship data; supports income verification |
| Reduce large irregular deposits | During review window | Avoids sourcing questions that delay or reprice application |
| Apply with primary bank first | Before external shopping | Accesses relationship rate; provides pricing benchmark |
| Choose look-back window strategically | Before authorizing bank link | Can shift income average by 10–20%+ for self-employed |
Do not deposit large, unexplained lump sums into your account in the 30 to 60 days before applying in an attempt to inflate your apparent balance. Underwriters are specifically trained to identify this pattern. A sudden large deposit without a corresponding income event triggers a sourcing inquiry that can delay your application by weeks and, in some cases, results in a rate revision if the funds cannot be verified as coming from a disclosed, legitimate source.
Rate Shopping Is Not Optional
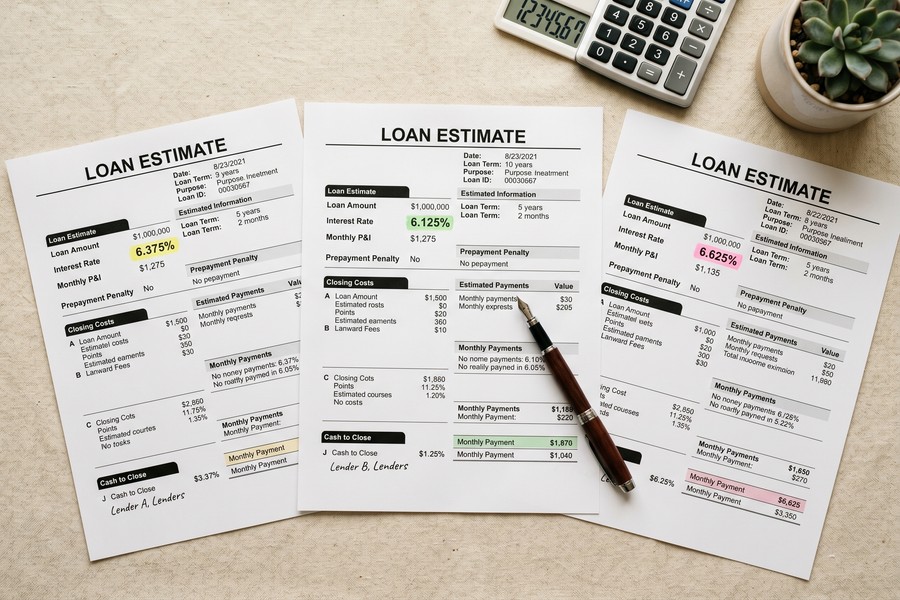
Even after you have done the behavioral housekeeping, rate shopping with multiple lenders remains one of the highest-leverage actions available. Different lenders weight the five data points in this article differently. A bank that knows you as a depositor may offer a relationship rate that a fintech cannot match. A fintech using advanced cash-flow scoring may offer a better rate to a gig worker with irregular income than a traditional bank’s underwriting model would produce. The only way to know which lender’s model works in your favor is to get multiple quotes. For a deeper look at how loan structure affects total cost beyond the rate itself, see our analysis of how loan term length controls total interest paid.
Checking your own bank account data through a consumer-facing open banking tool before applying for a loan gives you the same view a lender will see, and lets you identify and address any red flags before they affect your rate quote. Several fintech apps now offer this as a feature, allowing you to review your own cash-flow score before submitting an application.
Real-World Example: How Banking Behavior Moved One Borrower’s Rate by 3.4 Points
Consider an illustrative example: a borrower, call them Jordan, applied for a $20,000 personal loan in February 2025 and received an offer at 21.6% APR. Jordan’s FICO score was 694, which placed them in the near-prime tier. The lender had reviewed 90 days of checking account statements and found: an average daily balance of $312, two NSF events in the prior six months, irregular deposit timing (Jordan was a freelance graphic designer with variable project payments), and a cash-flow volatility score that flagged high month-to-month balance swings.
Jordan did not accept the offer. Instead, Jordan spent the following 90 days restructuring their banking behavior: moved three months of emergency reserves into their primary checking account (raising ADB from $312 to approximately $1,850), set up an automatic transfer from savings to cover any potential shortfall before recurring obligations cleared (eliminating the NSF risk), and consolidated two years of client payment history into a single bank account that could be submitted for a look-back review. Jordan also registered direct deposit with a new client whose ACH payments would arrive on a consistent weekly schedule. No credit score change was involved, the FICO remained at 697 after the 90-day period, a negligible improvement.
In June 2025, Jordan reapplied at the same lender and two additional institutions. The original lender came back at 18.9% APR. One of the new lenders, a fintech using cash-flow scoring, offered 18.2% APR. The third institution, where Jordan had held a checking account for four years with a solid prior record, offered 17.2% APR, a 3.4 percentage point reduction from the February quote on an unchanged FICO score. On a $20,000 loan over 48 months, that difference in rate equals approximately $1,680 in total interest savings.
The lesson is not that credit scores are irrelevant. It is that for near-prime and thin-file borrowers, banking behavior is the variable that moves most freely in a short window, and lenders are actively measuring it. Jordan’s case also illustrates why applying with the institution that holds your longest account history produces results that a cold application to a new lender cannot replicate: four years of clean transaction data offset information uncertainty in a way that 90 days of improved behavior alone cannot.
Your Action Plan
-
Pull 90 days of your own bank statements and calculate your average daily balance
Add up every end-of-day balance across the 90-day period and divide by 90. If the result is lower than two months of your proposed new monthly payment plus your current fixed obligations, you have work to do before applying. This calculation is the same one a lender’s underwriting software will run, so knowing your number in advance lets you set a target.
-
Identify and eliminate overdraft risk in the application window
Set a minimum balance alert at $500 or one month of fixed obligations, whichever is higher. If your bank does not offer real-time alerts, switch to a bank that does. The goal is to go 90 consecutive days without a single NSF or overdraft event before your application date, removing both the regulatory trigger and the behavioral signal from the review window.
-
Stabilize your deposit timing
If you are self-employed or receive irregular income, do whatever is practical to make deposits arrive on a predictable schedule. This may mean invoicing weekly instead of monthly, setting up a business account that feeds your personal account on a fixed transfer date, or requesting net-15 rather than net-30 payment terms from your largest clients. Consistent deposit timing is a measurable positive signal to cash-flow scoring systems.
-
Understand your look-back window options before authorizing data access
Before you click “Connect Your Bank Account” or authorize a bank-statement review, calculate your average monthly income across both 12-month and 24-month windows. Submit the window that produces the stronger income average and the cleaner behavioral pattern. For borrowers applying to a lender with no prior banking relationship, ask specifically how long the lender retains the data and what happens to it if your application is declined.
-
Apply with your primary bank or credit union first
Before shopping externally, submit an application to the institution where you hold your longest-tenured, highest-activity account. This accesses any relationship-rate discount built into the lender’s pricing model and gives you a benchmark offer backed by your best available behavioral data. Use this rate as your floor when negotiating with external lenders. For further detail on how fintech lenders use alternative data versus traditional institutions, see our article on how fintech lenders use payroll data to approve non-traditional borrowers.
-
Shop with at least two additional lenders, including one fintech
Different underwriting models weight the five data points differently. A fintech using Experian’s Cashflow Score or Equifax’s Prism may price your application more favorably than a traditional bank if your cash-flow patterns are strong but your credit file is thin. Rate shopping does not meaningfully harm your credit score when inquiries are clustered within a 14 to 45-day window, depending on the scoring model.
-
Address the debt-to-income ratio that emerges from your transaction data
Bank transaction data is increasingly used to recalculate your true DTI, capturing recurring obligations that may not appear on your credit bureau report (rent paid by ACH, subscriptions, insurance premiums). Before applying, add up every recurring ACH debit from your account over the prior 60 days and compare that total to your documented monthly income. If the result exceeds 43% of gross monthly income, focus on reducing recurring outflows before applying. Our dedicated article on debt-to-income ratio on digital lending platforms covers this calculation in detail.
-
Monitor your progress with a pre-application cash-flow check
Several fintech tools now offer consumers a view of their own cash-flow profile as lenders would see it. Running this check 30 days before your planned application date gives you enough time to address any remaining flags, a lingering overdraft, a suspicious large deposit that needs documentation, or an ADB that has dipped back down, without having to delay your application. Treat this as a pre-flight check, not an optional step.
Frequently Asked Questions
Do all lenders look at my bank account history, or only certain types?
Not all lenders use bank-account transaction data in their underwriting, but the practice is becoming standard rather than exceptional. Traditional banks and credit unions have long reviewed bank statements for mortgage and large personal loan applications. Fintech lenders have made it a default step for nearly all loan types, using automated data-aggregation tools to pull and analyze transaction history in seconds. As of mid-2025, fintech lenders originate more than half of all personal loans, meaning the majority of new personal loan applications now involve some form of cash-flow or bank-history analysis.
Can I refuse to link my bank accounts during a loan application?
Yes. Linking accounts via open banking is permissioned, you must actively consent. The consequence of refusing is that the lender falls back on traditional documentation (paper statements, pay stubs, tax returns) or declines to proceed without the data. In some cases, refusing to link accounts results in a higher rate because the lender compensates for the information gap with a wider risk margin. Knowing this, the strategic question is not whether to share data, but whether your banking history supports sharing it.
How far back do lenders typically look at banking history?
For standard personal loan applications, 60 to 90 days of bank statements is typical. For mortgage underwriting, lenders routinely review 12 to 24 months of statements. Self-employed borrowers applying for bank-statement loans are almost always evaluated on 12 or 24 months of transaction history, with the borrower or broker often choosing the look-back period strategically based on which window produces the most favorable income average and behavioral pattern.
What is an average daily balance and how do I calculate mine?
Your average daily balance is the sum of your account’s end-of-day balance for every day in a period, divided by the number of days in that period. For a 90-day calculation: record your balance at the end of each day for 90 days, add all 90 figures together, then divide by 90. Most banking apps do not display this figure directly, which is why many borrowers are unaware of how different it can be from their month-end balance. Some online banking dashboards offer a “monthly average balance”; that figure, averaged across three months, is a reasonable proxy.
Does a single overdraft from two years ago still affect my loan rate?
A single isolated overdraft event from two years ago is unlikely to materially affect your rate, particularly if your banking history since then has been clean. Underwriters distinguish between an anomaly and a pattern. What changes the calculus is frequency and recency: three or more overdrafts in the prior 12 months, or any NSF event within the past six months, carry significantly more weight and may trigger the formal re-underwriting requirements under Freddie Mac or FHA guidelines.
What is a Cashflow Score and do I have one?
Experian’s Cashflow Score, launched in March 2025, is a numeric score on a 300 to 850 scale derived from transaction-level bank account data. Equifax offers similar products under the Prism and CashScore names. These scores translate behavioral banking patterns, average balance levels, income consistency, overdraft history, cash-flow volatility, into a standardized number that lenders can incorporate into their rate-setting models alongside your traditional credit score. Whether you have a score depends on whether a lender has requested one and whether you have connected a bank account to a permissioned data aggregator. Consumer-facing versions of these scores are beginning to appear in fintech apps and credit monitoring services.
Can strong banking history compensate for a lower credit score?
In some lending models, yes, particularly among fintech lenders that explicitly weight cash-flow data as a primary underwriting input. FinRegLab’s research confirms that cash-flow variables are independently predictive of credit risk and that adding them to bureau data improves predictiveness for borrowers at all credit tiers. For thin-file and near-prime borrowers, a clean, stable banking history can meaningfully improve approval odds and rate outcomes beyond what the FICO score alone would produce. Traditional bank underwriting models are less likely to formally substitute banking history for credit score, but relationship history still affects the risk-premium portion of the rate.
How does debt-to-income ratio interact with bank history data?
Lenders traditionally calculate DTI from documented income (pay stubs, W-2s) versus reported monthly obligations (from the credit bureau). Transaction data adds a third dimension: actual recurring outflows visible in the bank account, which may include expenses not captured on the credit report. Rent paid by ACH, insurance premiums, and subscription services can push a borrower’s effective DTI materially above the figure a bureau-only calculation produces. This matters because many loan programs have DTI caps (often 43% to 50%), and exceeding those caps can result in denial or a higher rate. Our article on DTI on digital lending platforms covers this interaction in detail.
Is the CFPB Section 1033 rule currently protecting my data rights?
The Section 1033 rule is in legal limbo. It was finalized in October 2024 but was stayed by a federal court in early 2025, meaning its full framework is not yet enforceable. Consumer protections that the rule would have standardized, including limits on third-party data retention and clearer opt-out rights, are not uniformly in place. What applies to your specific application depends on your lender’s internal policies, any state-level privacy laws in your state, and the terms you agree to when consenting to account linking. Reading the data-use consent language carefully before linking accounts is more important during this regulatory gap than it would be under a stable rule.
Does rate shopping hurt my credit score if multiple lenders pull my bank data?
Soft credit pulls for pre-qualification generally do not affect your credit score. Hard credit inquiries do, but major scoring models, FICO and VantageScore, treat multiple hard inquiries for the same loan type within a defined window (14 to 45 days depending on the model version) as a single inquiry for scoring purposes. This rate-shopping protection applies to mortgage, auto, and student loan inquiries and generally extends to personal loans as well. Bank account access via open banking is a separate data pull and does not itself affect your credit score.
Sources
- Federal Reserve Bank of Minneapolis, How Do Lenders Set Interest Rates on Loans
- Consumer Financial Protection Bureau, CFPB Finalizes Personal Financial Data Rights Rule
- FinRegLab, Fact Sheet: Cash Flow Data in Underwriting Credit
- FinRegLab, The Use of Cash Flow Data in Underwriting Credit: Market Context and Policy Analysis
- FinRegLab, Study Finds Improvements in Consumer Underwriting from Machine Learning and Cash Flow Data
- Office of the Comptroller of the Currency, Comptroller’s Handbook: Interest Rate Risk
- NerdWallet, Average Personal Loan Interest Rates
- LendingTree, Personal Loan Statistics and Trends
- Bankrate, Personal Loan Rates Forecast and Fintech Market Share
- The Motley Fool, Personal Loan Statistics
- CapitalLendingNews, How Fintech Lenders Are Using Payroll Data to Approve Borrowers Banks Would Reject
- CapitalLendingNews, Debt-to-Income Ratio on Digital Lending Platforms
- CapitalLendingNews, How Gig Economy Workers Pay a Higher Effective Interest Rate Than Traditional Employees
- CapitalLendingNews, How Loan Term Length Quietly Controls How Much Interest You Actually Pay
- CapitalLendingNews, Fixed vs Adjustable Rate Loans for Self-Employed Borrowers