
Fact-checked by the CapitalLendingNews editorial team
Quick Answer
Mortgage rates by state can differ by 0.50% to 1.00% or more on the same loan type, driven by state taxes, foreclosure laws, lender competition, and local housing market risk. Borrowers in high-cost or lender-scarce states may pay thousands more over the life of a loan. Compare at least three lenders, understand your state’s cost drivers, and shop nationally to offset local rate premiums.
Understanding mortgage rates by state is one of the most overlooked factors in the homebuying process, yet it directly affects how much you pay every month. The Freddie Mac Primary Mortgage Market Survey shows the national average 30-year fixed rate hovering near 6.85%, but borrowers in certain states are routinely quoted rates a full percentage point above or below that figure on identical loan profiles.
With home prices still elevated and affordability stretched thin in many metros, a 0.75% rate difference on a $400,000 mortgage translates to roughly $190 more per month, or over $68,000 in extra interest over 30 years. State-level policy changes, shifting lender competition, and post-pandemic housing demand have all widened geographic rate gaps in recent years.
This guide is for homebuyers, refinancing homeowners, and real estate investors who want to understand why their state drives their rate and what they can do to close the gap. By the time you finish, you will be able to identify the key cost drivers in your state, compare rate environments across markets, and take actionable steps to secure the most competitive offer available to you.
Key Takeaways
- Rates vary by up to 1.00%+ across states on the same 30-year fixed loan, according to CFPB rate explorer data, meaning geography is as important as credit score for some borrowers.
- States with judicial foreclosure processes, like New York and Florida, typically carry higher rates because lenders face longer, costlier recovery timelines when loans default.
- Borrowers who compare at least three lenders save an average of $1,500 over the first five years of a mortgage, per CFPB research on mortgage shopping.
- State-level mortgage taxes and recording fees can add 0.20% to 0.50% to the effective cost of borrowing in high-tax states like New York and Maryland, per Urban Institute housing finance research.
- Lender competition is a primary rate driver: states with fewer active mortgage lenders see rates that run 0.25% to 0.50% higher than states with dense lender markets, based on CFPB HMDA loan origination data.
- Homebuyers in states with robust first-time buyer assistance programs, such as California’s CalHFA or Texas’s TDHCA, can access below-market rates that offset local pricing disadvantages.
In This Guide
- Why do mortgage rates differ from state to state?
- Which states currently have the lowest and highest mortgage rates?
- How do state foreclosure laws affect the mortgage rate you’re offered?
- How do I compare mortgage rates by state to find the best deal?
- What state programs can lower my mortgage rate?
- Should I use a local lender or a national lender to get a better rate in my state?
- Frequently Asked Questions
Step 1: Why Do Mortgage Rates Differ From State to State?
Mortgage rates vary by state because lenders price risk and cost into every loan, and both of those factors change depending on where the property sits. The same borrower with the same credit score, income, and down payment will receive different offers in Texas versus New Jersey, because state law, taxes, and local market conditions create measurably different cost structures for lenders.
The Core Drivers Behind State-Level Rate Differences
There are five primary forces that push mortgage rates by state up or down relative to the national average:
- Foreclosure law type: States using judicial foreclosure (court-supervised) impose longer, more expensive default timelines on lenders. That added risk premium shows up in higher rates.
- State and local taxes: Mortgage recording taxes, transfer taxes, and intangible taxes directly inflate closing costs and are sometimes factored into the rate itself.
- Lender competition density: Markets with more competing lenders drive rates down through competition. Rural or smaller-population states with fewer originators tend to price higher.
- Local housing market volatility: States prone to rapid price swings carry more collateral risk for lenders, which increases pricing.
- State-specific regulations: Some states impose additional consumer protections or disclosure requirements that increase lender compliance costs, which are passed along to borrowers.
What to Watch Out For
Many borrowers assume their rate is set entirely by the Federal Reserve’s benchmark or their personal financial profile. The CFPB’s loan estimate explorer shows clearly that state selection and lender selection interact to produce your final offer. Ignoring state-level cost drivers can mean leaving significant savings on the table.
The Federal Reserve sets the federal funds rate, but it does not set mortgage rates directly. Lenders price 30-year fixed mortgages primarily based on 10-year U.S. Treasury yields, and then layer state-specific costs and risk premiums on top of that baseline. Understanding how mortgage rates have shifted in 2026 gives helpful context for reading current state-level spreads.
Step 2: Which States Currently Have the Lowest and Highest Mortgage Rates?
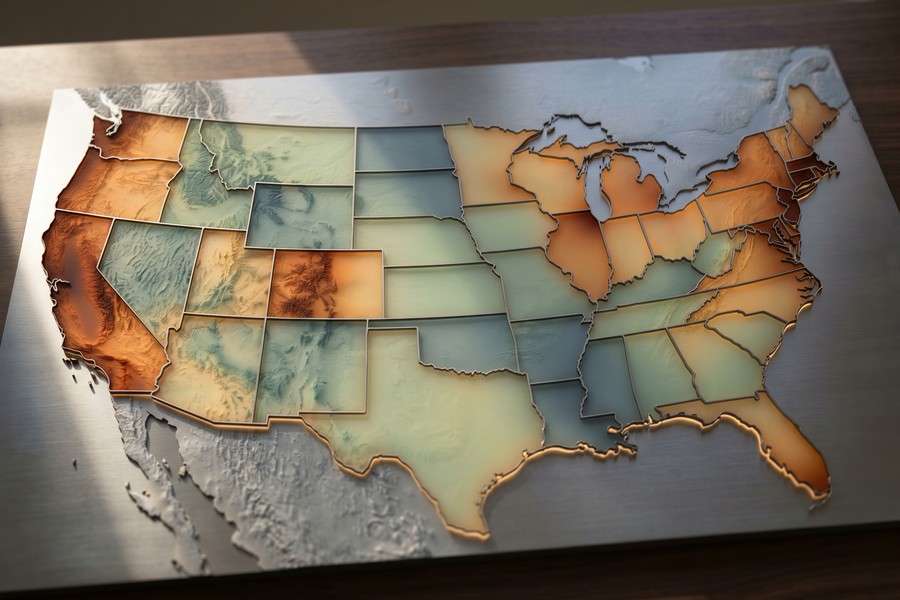
States in the Midwest and South, particularly Iowa, Missouri, and Kansas, consistently rank among the lowest for 30-year fixed mortgage rates, often running 0.25% to 0.50% below the national average. Conversely, states like New York, Hawaii, and New Jersey frequently sit at the top of the rate range, driven by high taxes, judicial foreclosure exposure, and concentrated urban lending costs.
A Snapshot of State-Level Rate Patterns
While rates shift weekly, the structural gap between low-rate and high-rate states tends to persist. According to CFPB Home Mortgage Disclosure Act (HMDA) data, the spread between the highest and lowest state averages has ranged from 0.50% to over 1.10% in recent years.
Lower-rate states share common traits: non-judicial foreclosure processes, lower property tax burdens, no mortgage recording taxes, and strong lender competition from both regional banks and national online lenders. Higher-rate states tend to cluster in the Northeast and parts of the South where legal and tax complexity raises lender costs.
What to Watch Out For
Rate rankings shift over time and should not be used as the sole input for deciding where to buy. A low-rate state with a weaker job market or limited housing inventory may cost more when all factors are considered. Always weigh the rate environment against the total cost of homeownership in a given market.
On a $350,000 loan, the difference between a 6.50% rate (low-rate state) and a 7.25% rate (high-rate state) amounts to roughly $162 per month and approximately $58,300 in total interest over 30 years. That gap is driven entirely by geography and lender selection, not borrower creditworthiness.
Step 3: How Do State Foreclosure Laws Affect the Mortgage Rate You’re Offered?
Foreclosure law is one of the single strongest predictors of whether a state will carry above-average mortgage rates. In judicial foreclosure states, lenders must file a lawsuit and win a court judgment before repossessing a property. That process can take 2 to 5 years in states like New York and New Jersey, and the extended timeline increases lender risk and cost, which gets priced into the rate offered to every borrower in that state.
Judicial vs. Non-Judicial Foreclosure: The Rate Impact
In non-judicial foreclosure states, including California, Texas, Georgia, and most Western states, lenders can execute a foreclosure through a deed-of-trust process, often completing it in 90 to 180 days. That speed dramatically reduces carrying costs and default risk, allowing lenders to price loans more competitively.
Research from the Urban Institute’s Housing Finance Policy Center has found that borrowers in judicial foreclosure states pay a measurable risk premium embedded in their mortgage offers, even when their personal financials are identical to borrowers in non-judicial states.
The foreclosure timeline functions as an insurance problem for lenders. The longer a lender must wait to recover a defaulted asset, the more it needs to charge every borrower upfront to cover that contingent cost. Borrowers in slow-foreclosure states effectively subsidize each other’s risk through higher baseline rates, a structural feature that no amount of credit-score improvement can fully eliminate.
How to Use This Information
If you are buying in a judicial foreclosure state, recognize that some portion of your rate is structural and cannot be fully negotiated away. Your best offset is to increase your down payment (reducing the lender’s collateral risk), maintain a credit score above 740, and compare offers from both local and national lenders, particularly online platforms that operate with thinner margins.
What to Watch Out For
Some states have hybrid systems or have recently updated their foreclosure laws. Always verify your state’s current foreclosure classification through the Consumer Financial Protection Bureau (CFPB) or a local real estate attorney before assuming your state falls cleanly into one category.
| State Category | Example States | Foreclosure Timeline | Typical Rate vs. National Avg. | Key Driver |
|---|---|---|---|---|
| Judicial (Slow) | New York, New Jersey, Florida, Illinois | 2–5 years | +0.25% to +0.75% | Court process, high lender carrying cost |
| Non-Judicial (Fast) | Texas, California, Georgia, Colorado | 90–180 days | Near or below national average | Deed-of-trust system, lower lender risk |
| High-Tax States | New York, Maryland, Minnesota | Varies | +0.20% to +0.50% effective cost | Mortgage recording/intangible taxes |
| Low-Tax Midwest | Iowa, Missouri, Kansas, Indiana | 60–180 days | -0.15% to -0.40% | Low taxes, non-judicial, strong competition |
| High-Cost West | Hawaii, California (select markets) | 90–150 days | +0.10% to +0.40% | High property values, regulatory complexity |
Florida is technically a judicial foreclosure state, yet it markets itself as a low-regulation housing market. The combination of judicial foreclosure timelines and rapid population-driven price volatility means Florida borrowers often see rates that are meaningfully above the national average, despite the state’s business-friendly reputation. Do not assume a low-tax state automatically means a low-rate mortgage market.
Step 4: How Do I Compare Mortgage Rates by State to Find the Best Deal?
To compare mortgage rates by state effectively, use a combination of the CFPB’s loan estimate tool, multiple online lenders, and local mortgage brokers, then apply for pre-approval from at least three sources within a 45-day window to protect your credit score. A structured comparison approach is the single most reliable way to offset your state’s structural rate disadvantages.
How to Do This
Follow these steps to build a genuine rate comparison:
- Start with the CFPB rate explorer: The CFPB’s “Explore Interest Rates” tool lets you input your state, loan amount, down payment, and credit score range to see the distribution of rates currently being offered in your market. This gives you a realistic baseline before you contact any lender.
- Get quotes from national online lenders: Platforms like Better Mortgage, loanDepot, and Rocket Mortgage operate with lower overhead than branch-based banks and often quote below the state average. They are particularly useful as a benchmark for what the floor of your market looks like.
- Contact local credit unions: Credit unions frequently offer below-market rates to members and are not-for-profit entities. In states with thin lender competition, a local credit union can be your best option for avoiding the rate premium.
- Use a mortgage broker: In high-cost states, an independent mortgage broker with access to wholesale lender networks can sometimes secure rates that retail channels cannot match. Brokers are especially valuable in states like New York or Hawaii where the pricing environment is complex.
- Compare Loan Estimates, not just rate quotes: Federal law requires lenders to issue a standardized Loan Estimate within three business days of your application. Compare the Annual Percentage Rate (APR) across documents, not just the stated interest rate, to account for state-specific fees and points.
What to Watch Out For
Rate shopping windows matter. FICO scoring models treat multiple mortgage inquiries within a 45-day window as a single inquiry, so apply for pre-approval from multiple lenders during that window, not sequentially over months. Staggered applications can hurt your score and cost you the competitive rate you were shopping for.
If you are also considering whether an FHA or conventional loan better fits your situation, the rate environment by state interacts with loan type in important ways. Our comparison of FHA loan rates vs. conventional mortgage rates breaks down the long-term cost differences that state-level pricing can amplify.
When requesting rate quotes, give every lender the exact same loan scenario: same purchase price, same down payment percentage, same loan term, and the same credit score range. Even a small difference in stated parameters will produce incomparable quotes. Consistency is what turns rate shopping into a genuine apples-to-apples comparison.

Step 5: What State Programs Can Lower My Mortgage Rate?
Every U.S. state operates a Housing Finance Agency (HFA) that offers below-market mortgage rates, down payment assistance, and closing cost grants to qualifying buyers, often at rates 0.25% to 0.75% below what you would receive through a conventional retail lender. These programs are severely underutilized: according to the National Council of State Housing Agencies (NCSHA), only a fraction of eligible buyers access HFA assistance each year.
Major State Programs to Know
- California Housing Finance Agency (CalHFA): Offers 30-year fixed FHA and conventional loans at below-market rates, plus deferred-payment junior loans for down payment assistance. Income limits apply by county.
- Texas Department of Housing and Community Affairs (TDHCA): The My First Texas Home program provides 30-year fixed loans at competitive rates plus up to 5% down payment assistance for eligible buyers.
- New York State Homes and Community Renewal (HCR): The Achieving the Dream program targets low-income first-time buyers with rates significantly below market in a state that otherwise carries a premium.
- Florida Housing Finance Corporation: Offers the Florida First and HFA Preferred programs, which can offset some of the state’s judicial foreclosure rate premium through subsidized pricing.
- Illinois Housing Development Authority (IHDA): Provides fixed-rate mortgages at below-market rates bundled with closing cost assistance, particularly valuable in Chicago-area markets where costs run high.
How to Access These Programs
HFA programs are delivered through participating lenders. You apply through a bank or credit union approved by your state’s housing agency, not directly through the agency itself. Use the HUD-approved housing counselor locator to find agencies in your state that can point you to the right program and lender network.
What to Watch Out For
Most HFA programs carry income limits, purchase price caps, and first-time buyer requirements (typically defined as not owning a home in the past three years). Some programs also require completion of a homebuyer education course. These prerequisites are not difficult to meet, but they do take time to confirm, so factor that into your timeline.
There is also a meaningful trade-off worth naming: HFA loan rates are attractive, but the participating lender networks are smaller than the broader market. You may find fewer lenders to choose from, which limits your ability to negotiate on other loan terms. In some cases, a conventional lender offering a rate only slightly above the HFA rate, but with fewer restrictions and faster processing, may be the better call.
Repeat buyers are not always excluded. If you have existing equity, our guide on how repeat homebuyers can leverage equity to negotiate a lower mortgage rate covers strategies that work alongside or instead of state HFA programs.
Even if you do not qualify for an HFA mortgage due to income or purchase price limits, many state housing agencies offer standalone down payment assistance grants that can be paired with a conventional or FHA loan from any approved lender. A larger down payment directly reduces your lender’s risk exposure and can unlock a lower rate tier, even in high-cost states.
Step 6: Should I Use a Local Lender or a National Lender to Get a Better Rate in My State?
The best answer depends on your state’s rate environment. In highly competitive markets with low structural rates, a national online lender typically wins on price. In high-cost or regulatory-complex states, a local mortgage broker with wholesale access often outperforms both. The goal is not loyalty to one channel, it is using the right tool for your specific state’s market conditions.
Local vs. National: How to Think About It
National lenders like Rocket Mortgage, Better, and loanDepot compete on price across all 50 states and publish rate grids that are often below what retail bank branches quote. They are particularly strong in non-judicial, low-tax states where the structural rate environment is already favorable.
Local and regional lenders, community banks, credit unions, and independent mortgage brokers, offer advantages in states where relationships, local regulatory knowledge, and portfolio lending matter. In states like New York or Hawaii, a broker who knows how to work through state-specific overlays and has relationships with wholesale lenders can sometimes beat national platforms on both rate and speed.
According to Greg McBride, CFA, Chief Financial Analyst at Bankrate, borrowers make a mistake when they treat the mortgage market as uniform. A lender that dominates in Arizona may be relatively expensive in Massachusetts because their cost model does not absorb that state’s complexity as efficiently as a regional player who operates there every day. Knowing your local market structure is just as important as knowing your credit score.
How to Make the Final Decision
Run both channels in parallel. Get quotes from at least one national platform and at least one local lender or broker during your rate-shopping window. Compare the full Loan Estimate, including all state-specific fees, lender credits, and the APR. The channel with the lower APR on a like-for-like scenario wins, regardless of brand recognition.
For self-employed borrowers, the local vs. national choice is even more consequential. Some national platforms use automated underwriting that penalizes non-traditional income documentation. Our guide on how a self-employed borrower can qualify for a competitive mortgage rate explains how lender selection interacts with income documentation to affect your final rate.
What to Watch Out For
Be cautious of lenders who quote a low rate upfront but load the Loan Estimate with origination fees, discount points, or lender-specific charges that inflate the true cost. In high-fee states, this tactic is particularly common because borrowers are accustomed to seeing large closing cost line items and may not scrutinize which costs are state-imposed versus lender-imposed.

Rate buydowns, paying upfront discount points to reduce your rate, are worth evaluating carefully in high-rate states. If the structural rate premium in your state reflects foreclosure law risk rather than market inefficiency, buying down that rate may not save you money unless you plan to stay in the home long enough to recoup the upfront cost. Our breakdown of whether mortgage rate buydowns are worth paying for walks through the math in detail.
Frequently Asked Questions
Why is my mortgage rate higher than what I see advertised nationally?
Advertised national average rates are composite figures that do not reflect your state’s specific cost structure, your lender’s pricing model, or your individual financial profile. Your actual rate is built from the national baseline plus state-level adjustments for foreclosure law, taxes, and lender competition, then further adjusted for your credit score, loan-to-value ratio, and loan type. The rate you are quoted may be entirely correct for your state’s market even if it exceeds the headline figure.
Which states have the lowest mortgage rates right now?
States in the Midwest, particularly Iowa, Kansas, Missouri, and Indiana, consistently offer among the lowest mortgage rates in the country, typically running 0.20% to 0.40% below the national average. These states share non-judicial foreclosure systems, low mortgage taxes, and competitive lender markets. Rates shift weekly, so always verify current figures using the CFPB’s rate explorer tool with your specific loan parameters before drawing conclusions.
Does my credit score matter more than what state I live in for my mortgage rate?
Both matter significantly, but they affect different parts of your rate. Your credit score determines your position within your lender’s pricing tier, moving from a 680 to a 760 score can reduce your rate by 0.50% to 1.00%. Your state determines the floor of what rates are available to any borrower in that market. In practical terms, a strong credit score in a high-rate state can outperform a weaker score in a low-rate state, but the ideal outcome is a strong credit profile in a competitive lending environment.
Can I get a mortgage from a lender in a different state to get a lower rate?
Yes. National lenders are licensed in all 50 states and can originate loans on properties in any state where they hold a license. However, your rate will still reflect the state where the property is located, not where the lender is headquartered. The property’s state determines foreclosure law, recording taxes, and regulatory requirements. Choosing a national lender can improve competition and reduce margin, but it cannot eliminate your state’s structural cost components.
How much can I realistically save by shopping mortgage rates in my state?
Borrowers who obtain at least three competing Loan Estimates save an average of $1,500 over the first five years of their mortgage, per CFPB research. In high-cost states with wide lender pricing spreads, the savings can be substantially higher, sometimes $3,000 to $5,000 or more over the same period. The key is comparing full Loan Estimates, not just the stated interest rate, and including both local and national lenders in your comparison.
Do FHA loans have the same state-level rate differences as conventional loans?
FHA loans are subject to the same state-level cost drivers as conventional loans, foreclosure timelines, recording taxes, and lender competition all affect FHA pricing as well. However, because FHA loans carry federal mortgage insurance backing, lenders absorb somewhat less credit risk, which can compress state-level rate premiums slightly on FHA products. The spread between states is generally narrower on FHA loans than on conventional loans, but it is not eliminated. For a full cost breakdown, see our comparison of FHA vs. conventional mortgage rates over time.
What is a mortgage recording tax and which states charge it?
A mortgage recording tax is a state or local tax levied when a mortgage is recorded with the county. It is charged as a percentage of the loan amount and is paid at closing. New York charges up to 1.925% of the mortgage amount in New York City, making it one of the most significant state-imposed costs in the country. Maryland, Florida, Minnesota, and Alabama also impose mortgage recording or intangible taxes. These taxes are separate from the mortgage rate itself but directly increase the total cost of borrowing and should be factored into any state-level cost comparison.
Should I wait for rates to drop before buying, or lock in now given my state’s rate environment?
Rate timing decisions should account for both national rate trends and your state’s structural rate environment. In a state where rates are already elevated due to foreclosure law or tax structure, waiting for a national rate decline may not close the local gap as much as you expect, the structural premium persists regardless of where the Fed moves. If you can lock in a competitive rate now through aggressive lender comparison, that is often more reliable than forecasting rate movements. Our analysis of whether to refinance now or wait for rates to drop applies the same decision framework to your situation.
How do state mortgage rates affect my decision to buy vs. rent?
In high-rate states, the monthly cost of ownership rises relative to comparable rental costs, which can tip the buy-vs.-rent calculation toward renting, at least in the short term. When your state’s structural rate premium adds $150 to $250 per month to a mortgage payment, that changes the break-even timeline for homeownership. Run the calculation with your actual quoted rate, not the national average, to get an accurate picture. Factoring in long-term equity accumulation alongside rate costs gives you a more complete comparison than either metric alone.
How do I know if I am getting a fair mortgage rate for my state?
Use the CFPB’s interactive rate tool to see the current range of rates being offered in your state for your specific loan profile, it displays actual rate distributions, not just averages. If your quoted rate falls in the top 25% of that distribution, you likely have room to negotiate or shop further. Rates in the bottom quartile of your state’s distribution represent genuinely competitive offers. Use this benchmark before accepting any lender’s initial quote as final.
Sources
- Freddie Mac, Primary Mortgage Market Survey (PMMS)
- Consumer Financial Protection Bureau, Explore Interest Rates Tool
- Consumer Financial Protection Bureau, Home Mortgage Disclosure Act Data
- Consumer Financial Protection Bureau, Shop for a Mortgage and Save
- National Council of State Housing Agencies, State HFA Factbook
- Consumer Financial Protection Bureau, What Is a Loan Estimate?
- Bankrate, Current Mortgage Rates by State