
Fact-checked by the CapitalLendingNews editorial team
The Verdict
Buying in your 30s is usually worth it if you can stay in the home for at least 5 years, your local price-to-rent ratio is below 20, and total housing costs stay under 28% of gross income. It is not worth it if you may move sooner, you are in a high-cost metro with a ratio above 25, or you lack three to six months of post-purchase emergency savings.
The renting vs buying debate in your 30s has always carried milestone weight, but the math has shifted enough that old defaults no longer hold. The single factor that swings the decision most is your local price-to-rent ratio, and right now it is working against buyers in most major markets. According to the National Association of REALTORS’ housing affordability data, households earning $75,000 to $100,000 annually could afford only about 21% of active listings as of early 2025, down from nearly 49% in 2019. That collapse in what the typical 30-something can actually reach is the starting point for every calculation in this article.
This decision matters more in 2026 than it did even three years ago because the cost gap between owning and renting has widened to a point where getting it wrong by two years is expensive. The break-even timeline at current rates makes any short-term purchase a near-certain financial loss.
| Factor | Reasons to Buy | Reasons to Keep Renting |
|---|---|---|
| Equity and wealth building | Every mortgage payment reduces principal; median homeowner net worth is ~$430,000 vs. ~$10,000 for renters | Equity builds slowly: at 6.5%, roughly 75% of early payments go to interest, not principal |
| Monthly cost | Fixed mortgage payment protects against rent hikes over the long term | Renting a comparable home runs $700–$1,000/month less than full ownership cost on a $400K home at 6.5% |
| Hidden costs | You control the property and can choose how and when to spend on maintenance | Bankrate’s 2025 study puts non-mortgage ownership costs at $21,400/year, costs renters never face |
| Flexibility | Stability for school-age children, ability to customize the space, no landlord risk | Renting keeps you mobile for career moves, relationship changes, or remote work relocation |
| Rate environment | Locking in today means you avoid any future rate increases; refinancing is possible if rates fall | At 6.53% on a 30-year fixed, buying at 6%+ today could trap you in a high-rate mortgage if you need to move within 5 years |
| Down payment opportunity cost | Forced savings effect: homeowners build equity involuntarily, which renters often fail to replicate voluntarily | An $80K down payment invested at 6% annually grows to roughly $159,000 in 10 years, capital that buying permanently converts to illiquid equity |
Key Takeaways
- Buying is likely the right move if your local price-to-rent ratio is below 20, divide the home’s purchase price by the annual rent for a comparable property to find this number.
- You can confidently stay in the home for at least 5 years, ideally 7 or more, because closing costs of 2–5% going in and selling costs of 6–8% going out mean you need years just to break even.
- Your all-in monthly housing payment (principal, interest, taxes, insurance, maintenance) stays at or below 28% of your gross monthly income.
- You have a down payment of at least 10% of the purchase price plus a separate reserve of 3–6 months of living expenses after closing, not the same fund.
- Your employment income is stable and documented; the Consumer Financial Protection Bureau specifically flags unstable employment as a strong reason to keep renting.
- Your debt-to-income ratio is below 43% after accounting for the proposed mortgage payment, above that threshold, qualifying and managing the payment become genuinely difficult.
- You are not planning a major life change (marriage, divorce, first child, cross-country job move) within the next 24 months that would reset your location needs entirely.
Does Your Local Market Even Make Buying Rational?
The price-to-rent ratio is the fastest filter for whether buying deserves further analysis in your city. Divide the purchase price of a home by the annual rent you would pay for a comparable property. A ratio below 15 historically favors buying; above 20 favors renting; above 25 means the numbers almost never pencil out unless you are staying a very long time. Many coastal metro areas currently sit well above 25, which means renters there are not falling behind. They are making a defensible financial choice.
The Harvard Joint Center for Housing Studies’ 2025 State of the Nation’s Housing report found that high home prices and elevated interest rates reduced homebuying to its lowest level since the mid-1990s in 2025. Rents remain well above pre-pandemic levels simultaneously, leaving millions cost-burdened regardless of which path they choose. Neither option is cheap right now. The honest question is which cost structure works better for your specific numbers and timeline.
U.S. home prices have surged 50% since 2020, according to the Bipartisan Policy Center’s J. Ronald Terwilliger Center for Housing Policy. The median national existing home sale price reached $414,400 for full-year 2025, according to NAR data reported by PBS NewsHour. At that price point with 10% down and a 6.53% rate (the Freddie Mac Primary Mortgage Market Survey average as of the week of May 28, 2026), your principal and interest payment alone exceeds $2,500 per month before a single dollar of taxes, insurance, or maintenance.
Those figures reflect a Federal Reserve tightening cycle that has fundamentally repriced what borrowing costs. Lenders including Chase, Wells Fargo, and SoFi are all quoting rates in the same general band, so shopping multiple offers matters for the APR you lock in, even if the spread between lenders on a conventional 30-year fixed is often narrower than buyers expect.
What Buying Actually Costs Each Month, Not What Your Lender Shows You
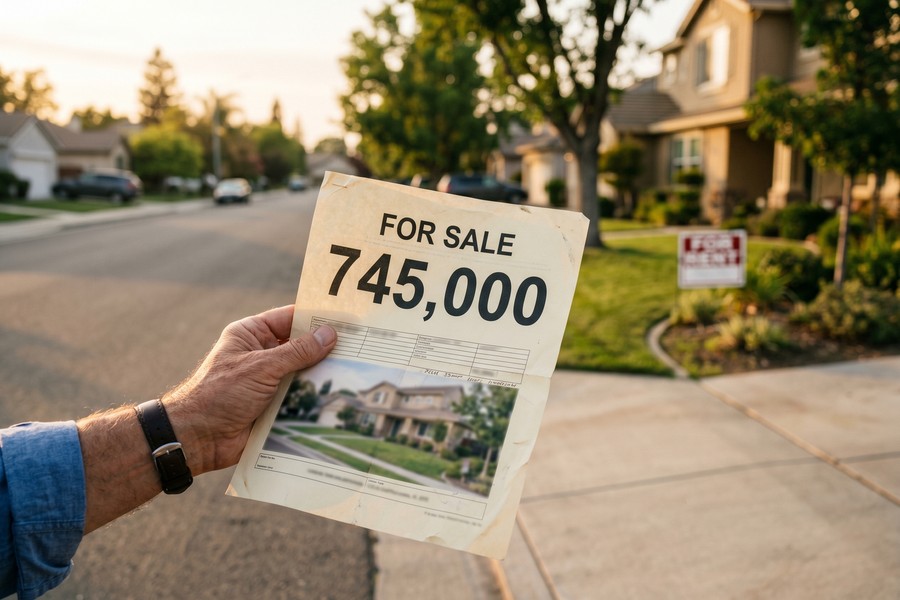
The real monthly cost of ownership is materially higher than the mortgage payment, and the gap surprises most buyers after they close. On a $414,000 home with 20% down at 6.5%, the PITI (principal, interest, taxes, and insurance) payment runs approximately $2,800 to $3,000 per month. Add maintenance (conventionally budgeted at 1% of home value annually), HOA fees where applicable, and utilities, and the all-in monthly cost typically reaches $3,200 to $3,600. A comparable rental in the same neighborhood often runs $2,200 to $2,500.
That $700 to $1,000 monthly gap is real money. Over five years, it compounds into $42,000 to $60,000 in additional cash outflow compared to renting. In the early years of a 30-year mortgage, equity accumulation is painfully slow. At 6.5%, roughly 75% of each payment goes toward interest rather than principal. Buyers expecting to build substantial equity in years one through three are working against basic amortization math.
The hidden costs are growing faster than most buyers budget for. Bankrate’s 2025 study found that non-mortgage homeownership expenses, property taxes, insurance, maintenance, and utilities, average $21,400 per year nationally. Homeowners insurance alone has risen approximately 70% since 2021 and is increasing roughly 8.7% faster than general inflation. That is an extra $1,750 per month beyond the mortgage that most online calculators quietly omit. Experian and other credit reporting agencies have documented how homeowners who absorb these surprise costs on credit cards can see their FICO Score fall within months of closing, which creates a compounding problem if they need to refinance later. If you are stress-testing your budget, that $21,400 figure needs to be a line item, not a footnote. For a deeper look at how loan structure affects total cost over time, see this breakdown of how loan term length quietly controls how much interest you actually pay.
The Down Payment Math Most Calculators Skip
Putting 20% down on a $414,000 home means deploying roughly $83,000 that will no longer be in a brokerage account. That is not a neutral choice. It is an opportunity cost, and most rent-vs-buy calculators never surface it honestly. If that $83,000 were invested in a diversified index fund earning 6% annually, it would grow to approximately $149,000 in 10 years, even without adding another dollar.
An AD Mortgage 2026 study analyzing 250 cities found that homeownership outperformed a renting-and-investing strategy in approximately 80% of markets over a 10-year horizon, even when researchers assumed renters reinvested both their down payment and their monthly savings differential. The forced-savings effect of a mortgage is real, particularly for people who lack the discipline or structure to invest consistently on their own. The 20% of markets where renting-and-investing came out ahead tend to be high-cost coastal metros where price-to-rent ratios exceed 25, exactly the cities where many 30-somethings live and work.
The wealth gap statistic deserves honest treatment. The median homeowner net worth is approximately $430,000 versus approximately $10,000 for renters, a striking number that appears in nearly every pro-buying argument. But it conflates the effect of homeownership with the effects of age, income level, and pre-existing wealth. Homeowners tend to be older and higher-income. Using that gap as proof that buying right now is correct for every 30-something is a logical shortcut the data does not support. What it does support is this: building equity eventually matters, and renting indefinitely while spending the monthly savings on consumption rather than investment will produce poor long-term outcomes.
NAR data makes the cost of delayed entry concrete. First-time buyers who wait a decade to purchase instead of buying in their 30s can forgo roughly $150,000 in equity accumulation on a typical starter home, based on historical appreciation rates on entry-level properties. That is not an argument to buy at any price or in any market. It is an argument to take the math seriously rather than defaulting to inertia.
How Long Do You Actually Need to Stay?
Five years is the floor, not a safe assumption. In many markets the honest break-even is closer to six or seven years. Transaction costs alone make short-term buying a near-certain financial loss: closing costs run 2% to 5% of the purchase price when you buy, and selling costs (agent commissions, transfer taxes, staging) typically run 6% to 8% when you sell. On a $414,000 home, that is $33,000 to $53,000 in pure transaction friction before you account for mortgage interest. At today’s rates, it takes several years of principal paydown and modest appreciation just to recover those costs.
The CFPB’s owning-a-home guidance notes explicitly that selling within the first few years of ownership can make buying financially disadvantageous, and that assumptions about home price growth can dramatically change outcomes. If you are modeling a purchase on the assumption that your home appreciates at 5% annually for the next decade, stress-test that assumption at 1% and 2%. The difference to your 10-year net position is tens of thousands of dollars.
There is also a forward-looking risk that almost no rent-vs-buy article addresses for 30-something buyers: the rate lock-in effect as a trap you could set for yourself. Approximately 48% of existing homeowners currently hold mortgages below 4%, and roughly 74% say they are unwilling to sell because they do not want to give up their rate. If you buy today at 6.5%, you could face exactly that same trap within five years, reluctant to move for a better job, a growing family’s space needs, or a relationship change because the financial penalty of selling and reborrowing is too large. That mobility cost does not show up in any monthly payment calculation, but it belongs in your decision. The FDIC has noted in consumer guidance that illiquidity risk in real estate is consistently underweighted by first-time buyers relative to the risk of holding cash or securities. If you are weighing whether to wait for rates to fall before committing, this analysis of whether to wait for mortgage rates to drop or lock in what you qualify for today is worth reading alongside these calculations.
Is Renting Into Your 30s Actually Behind Schedule?
No, and the data makes that clear. The median age of first-time homebuyers in the U.S. hit an all-time high of 40 years old in NAR’s 2025 survey, up from 38 in 2024 and 31 in 2014, according to NAR’s 2025 Profile of Home Buyers and Sellers. First-time buyers made up only 21% of all transactions during that period, the lowest share since NAR began tracking the metric in 1981. Renting in your 30s is statistically normal, not a personal failure.
The homeownership rate among householders aged 35 to 44 was 60.9% in the fourth quarter of 2025, according to Bipartisan Policy Center analysis of U.S. Census Bureau Housing Vacancy Survey data, nine percentage points below the 25-year quarterly high of 70.1% recorded in the first quarter of 2005. The structural barriers are real and well-documented. This is not a generation that failed to prioritize homeownership. It is a generation that entered the housing market during a 50% price surge and the highest mortgage rates in two decades.
That context matters for making a clear-headed decision. The social pressure to buy in your 30s carries weight that the actual numbers often do not support. Disciplined renting in a high-ratio market while investing the down payment and monthly savings differential is a legitimate wealth-building strategy. The key word is disciplined. Renters who spend the savings rather than invest them will, over 10 years, fall significantly behind homeowners in net worth accumulation. A lender like SoFi or a robo-adviser can make consistent investing mechanical enough that it does not require constant willpower, which matters more than most financial plans acknowledge. Consider pairing a renting strategy with a structured savings approach; this overview of zero-based budgeting versus the envelope method lays out which system works better for people trying to build a lump sum.
The Third Option: Buy and Collect Rent at the Same Time
House hacking, purchasing a small multi-unit property, living in one unit, and renting the others, reframes the entire buy-vs-rent question for 30s buyers in high-cost markets. If the rental income from one unit offsets 40% to 60% of your monthly mortgage payment, the effective housing cost drops dramatically. A duplex purchased for $500,000 in a market where each unit rents for $1,500 per month generates $18,000 per year in gross rental income. That substantially changes the monthly cost comparison that otherwise favors renting.
This strategy is almost entirely absent from mainstream rent-vs-buy advice aimed at 30-somethings, despite the fact that it directly addresses the affordability gap. It is not without complexity: being a landlord requires a cash reserve for vacancies and repairs, some management time, and a willingness to share your building. Your DTI calculation changes too, since rental income is typically counted at only 75% by most conventional lenders, including those following Fannie Mae guidelines. But for buyers who are serious about ownership and want the math to work, it deserves a genuine look. Those interested in how other landlords approach property-level financing can find relevant context in this piece on how landlords with multiple properties use fintech platforms to finance renovations.
Who Should and Who Should Not
Good candidates
Buying makes clear financial and practical sense for 30-somethings who meet most of these conditions.
- You live in or are moving to a mid-size or lower-cost market where the price-to-rent ratio is below 20 and the median home price is below $350,000, the math favors ownership much more strongly in these cities than in coastal metros.
- You have stable, documentable income for at least two years and a post-closing emergency fund of 3 to 6 months separate from the down payment.
- You are confident of staying in the same metro for at least 7 years, a job with strong local roots, a partner who is also settled, or school-age children who anchor you to a district.
- You want the non-financial benefits, stability for kids, freedom to renovate, protection from lease non-renewal, and are willing to absorb the higher monthly cost to get them.
- Your all-in monthly housing cost (including taxes, insurance, and a 1% annual maintenance reserve) will land below 28% of gross income, leaving room to absorb cost increases without stress.
Who should skip it
Renting is the better financial choice for 30-somethings in these specific situations.
- You are in a coastal metro (San Francisco, New York, Seattle, Los Angeles, Boston) where price-to-rent ratios consistently exceed 25, the monthly cost premium of owning over renting is so large that renting and investing the difference is a defensible wealth strategy, not a fallback.
- You have any realistic chance of relocating within the next 3 years for career growth, remote-work flexibility, or a relationship change, transaction costs alone will almost certainly put you underwater.
- Your employment income has been variable or interrupted recently; the CFPB explicitly names unstable employment as a strong reason to keep renting, and a missed mortgage payment carries consequences that a missed rent payment does not.
- You would drain your entire liquid savings to cover the down payment and closing costs, leaving no cash reserve for the maintenance surprises that hit the majority of new homeowners in the first 24 months.
Frequently Asked Questions
Is renting in your 30s throwing money away?
No, that framing ignores the real cost of ownership. Renting is exchanging money for housing and flexibility, just as buying exchanges money for housing and equity. At current rates and prices, renting a comparable home costs $700 to $1,000 per month less than owning, and that gap takes several years of equity accumulation to close. Renting becomes financially suboptimal only if you spend the savings rather than investing them.
What is the break-even point for buying vs renting right now?
At a 6.5% mortgage rate on a median-priced home, the break-even is typically 5 to 7 years after accounting for closing costs on entry and selling costs on exit. In high price-to-rent ratio markets, the break-even stretches to 8 or more years. Buying before that horizon with any uncertainty about staying is a high-risk financial decision.
How do I calculate the price-to-rent ratio for my city?
Divide the purchase price of a specific home by the annual rent for a genuinely comparable property in the same neighborhood. A ratio below 15 favors buying; 15 to 20 is a gray zone; above 20 favors renting. Use actual current listings on Zillow or Redfin for both inputs rather than averages, which can obscure large neighborhood-level differences.
Should I buy a home in my 30s if I can afford the payment but have limited savings?
No, payment affordability and financial readiness are not the same thing. The CFPB recommends modeling total monthly ownership costs against your full budget, and 81% of homeowners report that post-purchase costs exceeded expectations. If buying depletes your liquid savings, the first major repair (roof, HVAC, plumbing) can force you into high-interest debt. Hold off until you have the down payment, closing costs, and a separate 3 to 6 month emergency reserve.
Is it better to rent and invest the difference instead of buying a house?
In high price-to-rent markets above 25, yes, provided you actually invest the savings rather than spend them. An AD Mortgage 2026 study of 250 cities found homeownership outperformed renting and investing in roughly 80% of markets over 10 years, but the remaining 20%, mostly expensive coastal metros, are exactly where renting and investing in a diversified portfolio can produce comparable or better outcomes. The strategy requires discipline; renters who do not invest the difference consistently will underperform homeowners in net worth over any 10-year period.
What credit score do I need to buy a house in my 30s?
Conventional loans typically require a minimum FICO Score of 620, but scores below 740 usually trigger higher mortgage rates that materially increase total interest paid over the loan’s life. An FHA loan allows scores as low as 580 with 3.5% down, though FHA mortgage insurance premiums add to the monthly cost and the APR comparison between FHA and conventional loans is rarely straightforward. For a direct rate comparison between FHA and conventional paths, this breakdown of FHA loan rates vs conventional mortgage rates shows which costs less over time at different credit profiles. Improving your score before applying is nearly always worth the wait if you are close to the 740 threshold; Experian’s credit monitoring tools can help you track progress against that target in real time.
Sources
- National Association of REALTORS®, First-Time Home Buyer Share Falls to Historic Low of 21%, Median Age Rises to 40
- Consumer Financial Protection Bureau, Making the Decision to Rent or Buy
- Consumer Financial Protection Bureau, Consider Whether It’s the Right Time for You to Buy
- Harvard Joint Center for Housing Studies, The State of the Nation’s Housing 2025
- Bipartisan Policy Center, What Is the State of Homeownership Today?
- Freddie Mac, Primary Mortgage Market Survey (PMMS)
- National Association of REALTORS®, Housing Affordability and Supply
- PBS NewsHour, 2025 Home Sales Stuck at 30-Year Low